Just released: DevOps Metrics for Azure DevOps extension
Published October 28, 2020

Fullstack Developer
Gabriel Johansson
One of the core principles in DevOps is to measure your way to success. There is a good reason to this; Metrics can help the organization gain valuable insights into the development process. The metrics can be used to spot bottlenecks and areas for improvement, which can increase both quality and throughput for the teams. Maybe even more important, it will provide the foundation for building a more data-driven decision-making process. This in turn will enable the organization to be proactive instead of being reactive when it comes to adopt to new market needs and prevent being surpassed by its competitors.
Over the years, we have helped many customers to accelerate their development processes. This requires us to have a metrics-oriented mindset in our daily work. A bit surprisingly, we have sometimes struggled when it comes to DevOps performance metrics that are not natively supported in some of the tools we are using.
DevOps Metrics extension
The launch of the DevOps Metrics extension to Visual Studio Marketplace is our most recent attempt to mitigate a shortcoming with performance metrics in one of our most familiar products - Azure DevOps.
Many teams use dashboards in Azure DevOps to visualize and monitor progress. Therefore, it felt like a natural starting point to provide these metrics as dashboard widgets that can be combined with other widgets already used by the team.
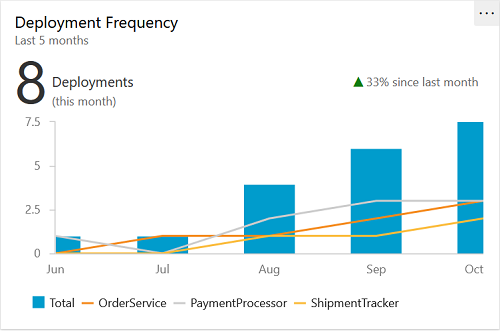
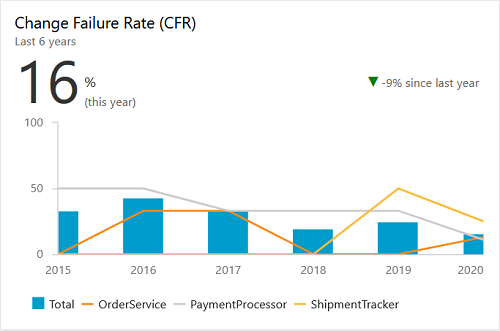
The current version of the DevOps Metrics extension adds support for two common DevOps performance metrics: Deployment Frequency and Change Failure Rate.
Deployment Frequency is a measure for how frequently your team deploys code. A high deployment frequency means that you are delivering new business value more often and in smaller increments (=lower risk). The ability to deploy new code changes frequently can be seen as a direct measure for how reliable (and automated) the deployment process is. Several reports have also shown that high performing teams deliver code more often that their lower performing peers.
Unlike Deployment Frequency which counts the number of successful deployments, Change Failure Rate measures the ratio of deployments where something goes wrong and a rollback or other remedial actions are required. A low change failure rate means that the process is mature and that you have managed to curb problems related to deployment and other quality aspects. On the contrary, a high change failure rate may indicate that the current quality measures are insufficient. Service degradations can lead to loss of revenue and unsatisfied customers. There are many good reasons to keep a close track of this measure.
Want to see more?
This is a new product that we will continue to develop and add support for more DevOps metrics. We have a good idea of what to build next but would also like to get feedback and ideas on what types of metrics you would like to see in this product.
If you want to reach out or need help measuring your way through DevOps, feel free to contact us here.